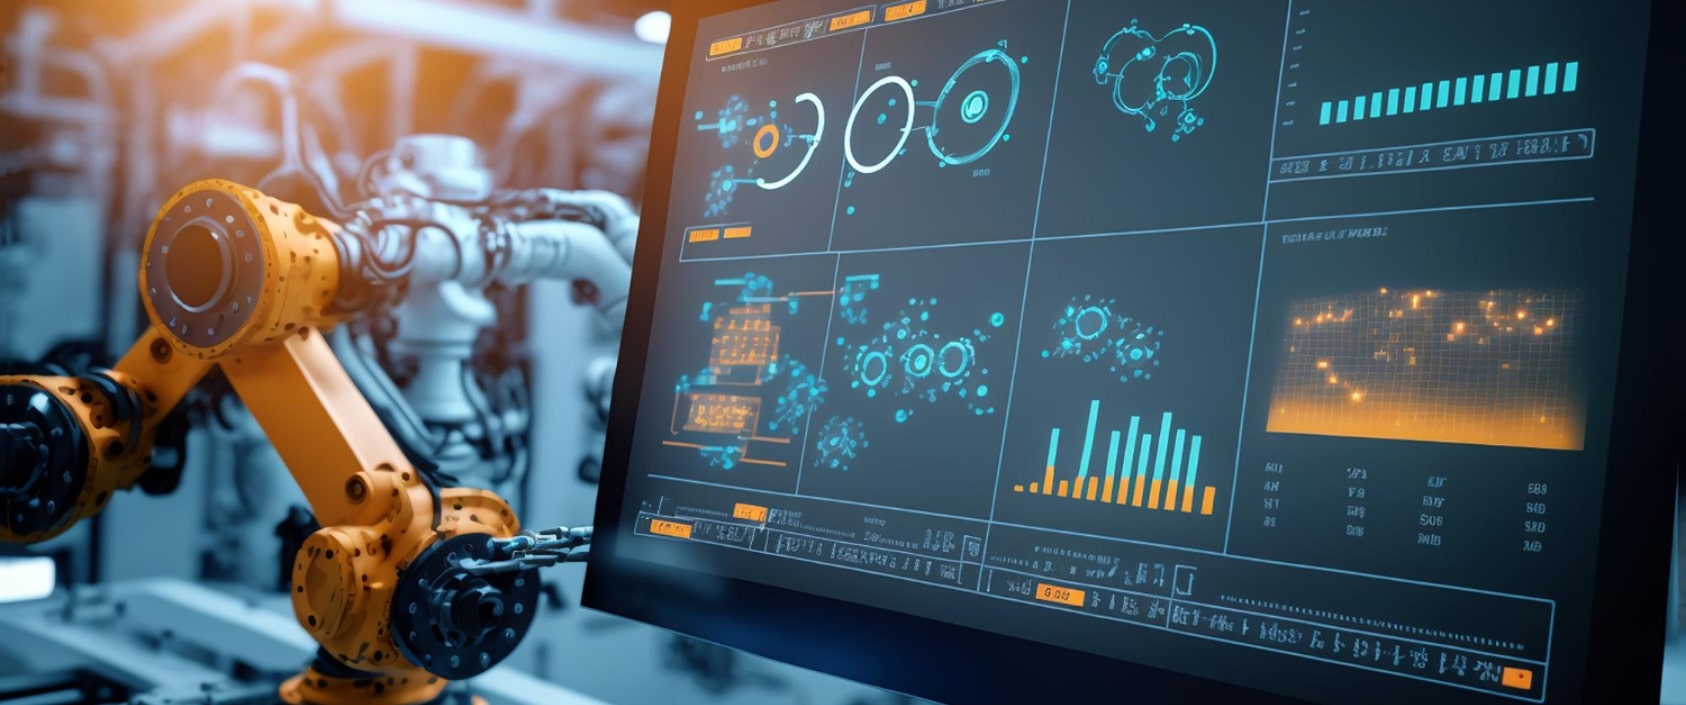
Artificial Intelligence (AI) has changed the way we analyze data. By automating the process of data interpretation, AI allows for more accurate insights.
In a nutshell, AI systems process large amounts of data much faster than a human, identifying patterns and correlations that might be missed otherwise.
Visual data, like images, videos, and graphical representations, have become vital assets in decision-making. It is an intuitive way for decision-makers to understand complex datasets.
AI enhances this by translating raw data into visually appealing and understandable formats.

AI visual data sources are as diverse as the applications they serve.
Data sources range from internal databases that store organized, structured data, to external sources like social media feeds and public datasets that offer unstructured data.
According to Needle.Ai, structured data includes quantifiable information. For instance, sales figures, inventory levels, and financial metrics. Unstructured data, on the other hand, includes different information types such as text from customer reviews, images, videos, and audio recordings.
The journey from raw data to actionable insights begins with preprocessing and cleaning. This refines the data to ensure its quality and relevance.
AI and machine learning algorithms play an important role here, automating tasks such as correcting errors, dealing with missing values, and normalizing datasets to ensure consistency.
Data cleaning is about enriching the data. For instance, AI algorithms can categorize and tag unstructured data, making it more accessible and meaningful for analysis.

AI for data visualization extends beyond traditional graphs and charts. Using algorithms, AI can create complex and intuitive graphic representations of data, making it easier to identify patterns.
These visualizations include heat maps that highlight areas of intensity or concentration in data, network diagrams that illustrate relationships and connections, and even advanced 3D visualizations that give a multi-dimensional view of data sets.
AI processes data and presents it in formats that are both informative and visually appealing.
One application of AI data visualization tools is the creation of interactive dashboards and reports. These tools are designed to update in real-time, offering continuous insights as new data is received.
With interactive dashboards, users can drill down into specific metrics, compare different periods, and even manipulate the data to explore various scenarios.
AI-driven dynamic data dashboards are a leap from traditional static reporting. These dashboards evolve as new data flows in, giving an always up-to-date snapshot of the situation.
Not only do they update with new data, but they also recalibrate their analyses and visualizations based on user interactions and changing information. This responsiveness makes them invaluable tools for responding to fast-changing situations.
Moreover, Onvo.Ai states that the capacity for user interaction with these dashboards adds a layer of personalization and exploration. Users can query the data, apply different filters, and view the results in various formats.
AI is great at generating automated insights from complex data sets.
By analyzing data patterns, AI can produce concise narratives and summaries that represent key findings. These narratives are insightful stories that make the data relatable and understandable.
Augmented data exploration further enhances this capability. Users can ask specific questions about their data and receive answers in the form of visual representations or written insights.
Visual data storytelling is an art that AI has mastered. It involves transforming dry, complex data into compelling visuals that capture the audience’s attention.
Simply put, AI makes it possible for non-technical users to understand the data.
This is especially important in a business context, where decision-makers may not have the time or technical background to delve into detailed data analysis.
At Flexible Vision, we offer an end-to-end factory solution for all your machine vision needs. Experience our technology designed for today’s industry.

Combining AI with visual data unlocks a powerful tool for predicting future trends.
In market analysis, visual data can include patterns in consumer behavior, graphical trends in sales over time, or heat maps of customer engagement across different regions.
AI algorithms analyze these visual inputs, identifying underlying patterns and making predictions about future trends. This is invaluable in adapting strategies to upcoming market changes or consumer preferences.
In retail, AI can forecast sales trends, helping stores manage inventory more effectively. In finance, it anticipates market shifts, guiding investment strategies.
This predictive capability gives businesses a competitive edge, allowing them to make proactive decisions rather than reactive ones. The ability to adapt to future scenarios can be the difference between leading the market and falling behind.
Regression analysis is used to understand the relationship between variables and predict a continuous outcome. Time series forecasting is crucial in identifying trends over time and making predictions accordingly.
Machine learning algorithms are at the heart of AI’s predictive power. These algorithms analyze historical data, learning from past trends and patterns to make informed predictions.
Over time, as more data is fed into these systems, the algorithms become increasingly accurate in their forecasts.
Start innovating your production processes today with Flexible Vision.
Identifying the right data features and variables is a critical step in predictive modeling.
AI helps businesses pinpoint key predictors in their data. These range from customer demographics and buying habits in retail to weather patterns and their impact on energy consumption in utilities.
Recognizing these variables allows businesses to focus their analysis on the most impactful data.
Dealing with seasonality and trends is a challenge in predictive analytics, but AI manages it perfectly. It identifies seasonal patterns in data, such as increased sales during holiday seasons or fluctuations in energy usage during different times of the year.
Predictive analytics finds its application in various business scenarios.
In sales and demand forecasting, it helps businesses anticipate market demand, optimizing supply chain and inventory management.
In risk management and fraud detection, TechRepublic notes that AI-driven predictive analytics help identify potential risks and fraudulent activities before they materialize. This allows businesses to take proactive measures.

AI’s capability in streaming data analytics is changing how businesses process information. By analyzing data in real-time as it’s generated, AI gives instant insights into current operations.
This is crucial in industries like telecommunications or social media, where consumer behavior and trends shift fast. Real-time analytics allows businesses to stay agile.
AI systems also excel in continuously monitoring data streams. These systems detect:
Anomalies
Unusual patterns
Significant trends
And will trigger alerts for immediate attention if anything suspicious is recorded.
This continuous oversight is ideal in cybersecurity, where detecting a breach immediately is crucial, or in healthcare, where real-time patient data monitoring is life-saving.
In today’s data-driven world, the ability to quickly process and interpret large volumes of information is a necessity. AI excels in this area, giving insights that are faster than traditional analysis methods.
This speed and depth of understanding allow businesses to anticipate market changes, adapt strategies rapidly, and respond to customer needs more effectively.
Essentially, no tool does it better than AI in formulating data-driven strategies. Businesses can now sift through data to identify key performance drivers and areas for improvement, thanks to AI.
As AI systems require access to large datasets to function effectively, the risk of data breaches and unauthorized access increases. Businesses must ensure that their AI systems comply with data protection regulations, such as GDPR in Europe or the CCPA in California.
Privacy concerns also extend to customer trust; companies must be transparent about their use of AI and how they handle customer data.
Cloud Security Alliance stresses the importance of AI systems being designed to make decisions that are fair, unbiased, and transparent.
This is important in fields like finance or healthcare, where AI-driven decisions have significant impacts on individuals’ lives.
Moreover, AI’s applications in data visualization and analysis are vast and varied. From improving decision-making to predicting future trends, AI’s role in business intelligence is crucial.
The future of AI and visual data looks promising. As technology advances, we can expect even more sophisticated tools for data analysis and visualization, further enhancing decision-making processes.
At Flexible Vision, our team each comes from 20+ years in the automation and vision world and has experienced all the pain points of implementing traditional vision systems on production lines.
AI enhances decision-making by converting complex data into clear visual formats. It uses algorithms to detect patterns and trends, presenting them through interactive graphs, charts, and dashboards.
AI-powered data visualization techniques include automated chart generation, heat maps for concentration analysis, time series visualizations for trend analysis, interactive dashboards for real-time data interaction, and geospatial mapping to integrate data with geographic contexts.
AI uses past data to forecast future trends. It employs machine learning algorithms for pattern recognition and predictive modeling, helping forecast future events like market trends or consumer behavior.